

Question: A study by Colliers International presented the highest and the lowest global rental rates (in U.S. dollars) per year per square foot of office space.
A study by Colliers International presented the highest and the lowest global rental rates (in U.S. dollars) per year per square foot of office space. Among the cities with the lowest rates were Perth, Australia; Edmonton; and Calgary, with rates of $8.81, $9.55, and $9.69, respectively. At the high end were Hong Kong, Mumbai, and Tokyo, with rates over $100. Suppose an analyst conducted her own survey of businesses renting office space to determine whether one city is significantly more expensive than another. The data are tallied and analyzed using a computer. The results follow. Discuss the output. Assume that rental rates are normally distributed in the population. What cities were studied? How large were the samples? What were the sample statistics? What was the value of α? What were the hypotheses, and what was the conclusion?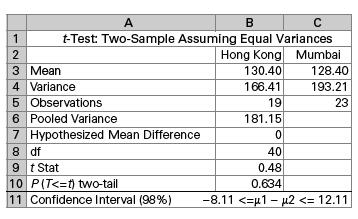
1 23 3 Mean A B C t-Test: Two-Sample Assuming Equal Variances Hong Kong Mumbai 130.40 166.41 19 181.15 4 Variance 5 Observations 6 Pooled Variance 7 Hypothesized Mean Difference 8 df 9 t Stat 10 P(T
Step by Step Solution
3.47 Rating (157 Votes )
There are 3 Steps involved in it
The output shows the results of an independent samples ttest conducted to compare the mean rental ra... View full answer

Get step-by-step solutions from verified subject matter experts