

Impact of September 11 on Air Travel in the United States. The Research and Innovative Technology Administration's
Question:
Impact of September 11 on Air Travel in the United States. The Research and Innovative Technology Administration's Bureau of Transportation Statistics conducted a study to evaluate the impact of the September 11, 2001 terrorist attack on US transportation. The 2006 study report and the data can be found at http://goo.gl/w2lJPV. The goal of the study was stated as follows:
The purpose of this study is to provide a greater understanding of the passenger travel behavior patterns of persons making long distance trips before and after \(9 / 11\).
The report analyzes monthly passenger movement data between January 1990 and May 2004. Data on three monthly time series are given in file Sept11Travel.xls for this period: (1) Actual airline revenue passenger miles (Air), (2) Rail passenger miles (Rail), and (3) Vehicle miles traveled (Car).
In order to assess the impact of September 11, BTS took the following approach: using data before September 11, they forecasted future data (under the assumption of no terrorist attack). Then they compared the forecasted series with the actual data to assess the impact of the event. Our first step, therefore, is to split each of the time series into two parts: pre- and post-September 11. We now concentrate only on the earlier time series.
a. Plot the pre-event AIR time series.
i. What time series components appear from the plot?
b. Figure 17.13 shows a time plot of the seasonally adjusted pre-September-11 AIR series.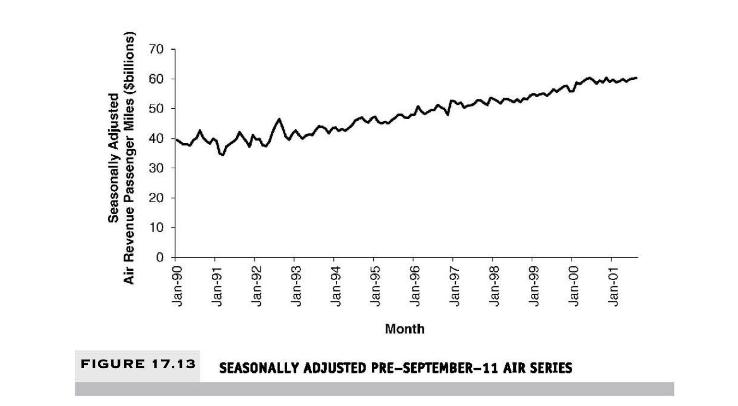
Which of the following methods would be adequate for forecasting the series shown in the figure?
- Linear regression model with dummies - Linear regression model with trend - Linear regression model with dummies and trend
c. Specify a linear regression model for the AIR series that would produce a seasonally adjusted series similar to the one shown in Figure 17.13, with multiplicative seasonality. What is the output variable? What are the predictors?
d. Run the regression model from (c). Remember to create dummy variables for the months (XLMiner will create 12 dummies; use only 11 and drop the April dummy) and to use only pre-event data.
i. What can we learn from the statistical insignificance of the coefficients for October and September?
ii. The actual value of AIR (air revenue passenger miles) in January 1990 was 35.153577 billion. What is the residual for this month, using the regression model? Report the residual in terms of air revenue passenger miles.
e. Create an ACF (autocorrelation) plot of the regression residuals.
i. What does the ACF plot tell us about the regression model's forecasts?
ii. How can this information be used to improve the model?
f. Fit linear regression models to Air, Rail, and Auto with additive seasonality and an appropriate trend. For Air and Rail, fit a linear trend. For Rail, use a quadratic trend. Remember to use only pre-event data. Once the models are estimated, use them to forecast each of the three post-event series.
i. For each series (Air, Rail, Auto), plot the complete pre-event and postevent actual series overlaid with the predicted series.
ii. What can be said about the effect of the September 11 terrorist attack on the three modes of transportation? Discuss the magnitude of the effect, its time span, and any other relevant aspects.
Step by Step Answer:

This question has not been answered yet.
You can Ask your question!


Data Mining For Business Analytics Concepts Techniques And Applications With XLMiner
ISBN: 9781118729274
3rd Edition
Authors: Peter C. Bruce, Galit Shmueli, Nitin R. Patel
