

Question: Lets chat (1.1) The bar graph displays data on students responses to the question Which of these methods do you most often use to communicate
Let’s chat (1.1) The bar graph displays data on students’ responses to the question “Which of these methods do you most often use to communicate with your friends?”Let’s chat (1.1) The bar graph displays data on students’ responses to the question “Which of these methods do you most often use to communicate with your friends?”
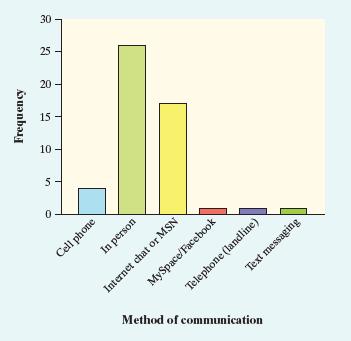
(a) Would it be appropriate to make a pie chart for these data? Why or why not?
(b) Jerry says that he would describe this bar graph as skewed to the right. Explain why Jerry is wrong.
Frequency 0 15 10 5 25 20 30 Cell phone In person Internet chat or MSN MySpace/Facebook Telephone (landline) Method of communication Text messaging
Step by Step Solution
There are 3 Steps involved in it

Get step-by-step solutions from verified subject matter experts