

Question: Shown here is the Excel output for a one-way ANOVA. Analyze the results. Include the number of treatment levels, the sample sizes, the F value,
Shown here is the Excel output for a one-way ANOVA. Analyze the results. Include the number of treatment levels, the sample sizes, the F value, the overall statistical significance of the test, and the values of the means.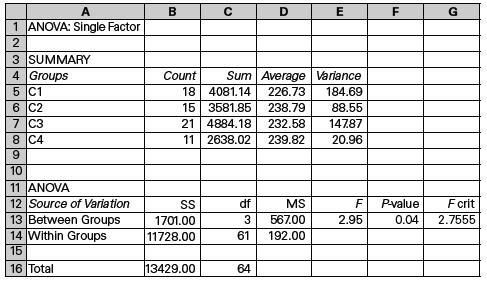
A 1 ANOVA: Single Factor 2 3 SUMMARY 4 Groups 5 C1 6 C2 7 C3 8 C4 9 10 11 ANOVA 12 Source of Variation 13 Between Groups 14 Within Groups 15 16 Total B Count SS 1701.00 11728.00 Sum Average Variance 18 4081.14 226.73 184.69 15 3581.85 238.79 88.55 21 4884.18 232.58 147.87 11 2638.02 239.82 20.96 13429.00 df MS 567.00 61 192.00 3 D | 64 E F 2.95 F TI P-value 0.04 G F crit 2.7555
Step by Step Solution
3.46 Rating (162 Votes )
There are 3 Steps involved in it
Since the observed F 1107 F 05214 374 ... View full answer

Get step-by-step solutions from verified subject matter experts