

Question: Study the following Excel regression output for an analysis attempting to predict the number of union members by the size of the labour force for
Study the following Excel regression output for an analysis attempting to predict the number of union members by the size of the labour force for selected years over a 30-year period. Analyze the computer output. Discuss the strength of the model in terms of the proportion of variation accounted for, slope, and overall predictability. Using the equation of the regression line, attempt to predict the number of union members when the labour force is 100,000. Note that the model was developed with data already recorded in units of 1,000. Use the data in the model as is.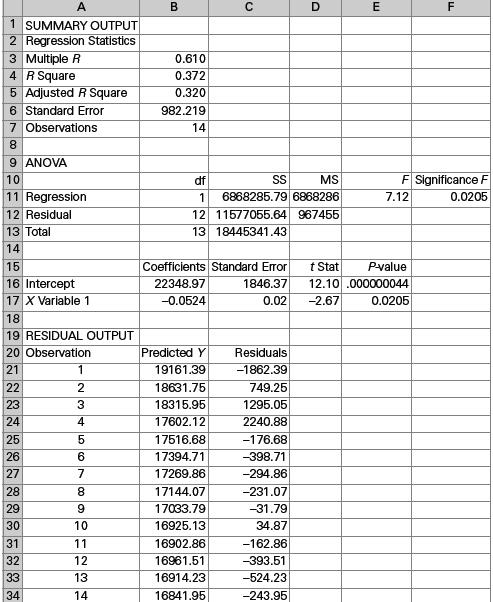
1 SUMMARY OUTPUT 2 Regression Statistics 3 Multiple R 4 R Square 5 Adjusted R Square 6 Standard Error 7 Observations 8 9 ANOVA 10 11 Regression 12 Residual 13 Total 14 15 16 Intercept 17 X Variable 1 18 19 RESIDUAL OUTPUT 20 Observation 21 22 23 24 25 26 27 28 29 30 31 32 33 34 1 2 3 4 5 6 7 8 9 10 11 12 13 14 B 0.610 0.372 0.320 982.219 14 U df MS 1 6868285.79 6868286 12 11577055.64 967455 13 18445341.43 SS Predicted Y 19161.39 18631.75 18315.95 17602.12 17516.68 17394.71 17269.86 17144.07 17033.79 16925.13 16902.86 16961.51 16914.23 16841.95 Coefficients Standard Error 22348.97 1846.37 -0.0524 0.02 Residuals -1862.39 749.25 1295.05 2240.88 -176.68 -398.71 -294.86 -231.07 -31.79 34.87 D -162.86 -393.51 -524.23 -243.95 E F Significance F 0.0205 7.12 F t Stat P-value 12.10 .000000044 -2.67 0.0205
Step by Step Solution
3.45 Rating (165 Votes )
There are 3 Steps involved in it
The regression analysis aims to predict the number of union members in the United States based on the size of the labor force Lets analyze the output ... View full answer

Get step-by-step solutions from verified subject matter experts