

Question: Study the residual diagnostics that follow. Discuss any potential problems with meeting the regression assumptions for this regression analysis based on the residual graphics. Percent
Study the residual diagnostics that follow. Discuss any potential problems with meeting the regression assumptions for this regression analysis based on the residual graphics.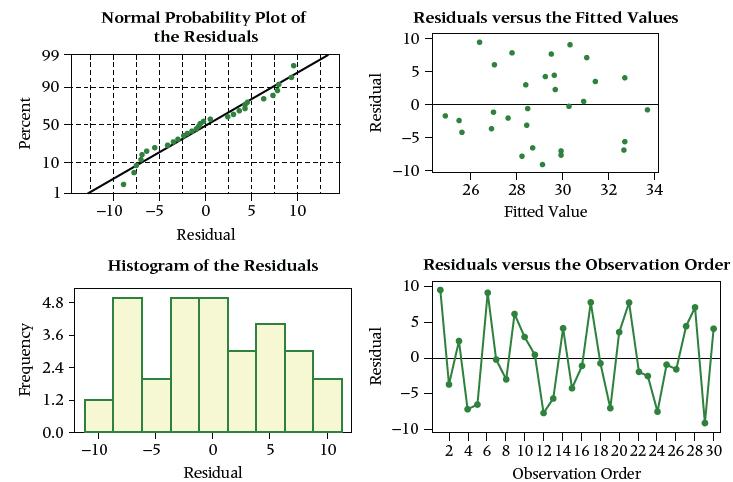
Percent Frequency 99 90 50 10 4.8 3.6 2.4 1.2 0.0 Normal Probability Plot of the Residuals TII -10 -5 0 5 10 Residual Histogram of the Residuals -10 -5 0 Residual T 5 Residual T 10 Residuals versus the Fitted Values 10 5 -5 10 5 HUMMA -5 -10 -10 26 28 30 32 34 Fitted Value Residuals versus the Observation Order 2 4 6 8 10 12 14 16 18 20 22 24 26 28 30 Observation Order
Step by Step Solution
3.52 Rating (155 Votes )
There are 3 Steps involved in it
The Histogram indicates that there may be some problem with the ... View full answer

Get step-by-step solutions from verified subject matter experts