Suppose the following data have been gathered from a study with a two-way factorial design. Use
Question:
Suppose the following data have been gathered from a study with a two-way factorial design. Use α = 0.05 and a two-way ANOVA to analyze the data. State your conclusions.
Transcribed Image Text:
Treatment 1 A X 1.2 1.3 1.3 1.5 Y 1.9 1.6 1.7 2.0 B 2.2 2.1 2.0 2.3 2.7 2.5 2.8 2.8 Treatment 2 C 1.7 1.8 1.7 1.6 1.9 2.2 1.9 2.0 D 2.4 2.3 2.5 2.4 2.8 2.6 2.4 2.8
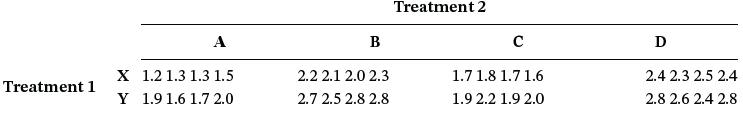
Fantastic news! We've Found the answer you've been seeking!
Step by Step Answer:
Answer rating: 75% (4 reviews)
Critical F 05324 301 for interaction For interaction the observed F ...View the full answer
Answered By
Joan Gakii
I'm a meticulous professional writer with over five years writing experience. My skill set includes
- Digital Content,
- Interpersonal Communication,
- Web Content and academic Writing,
- Proofreading,
- Editing,
- Project Management, and
- Public Relations.
5.00+
7+ Reviews
12+ Question Solved
Related Book For
Business Statistics For Contemporary Decision Making
ISBN: 9781119577621
3rd Canadian Edition
Authors: Ken Black, Ignacio Castillo
Question Posted:
Students also viewed these Business questions
-
Suppose the following data have been gathered from a study with a two-way factorial design. Use α = .05 and a two-way ANOVA to analyze the data. State yourconclusions. Treatment 2 X 1.2...
-
Suppose the following data have been gathered from a study with a two-way factorial design. Use = .05 and a two-way ANOVA to analyze the data. State yourconclusions. Treatment 2 A 1.2 1.3 1.3 .5 2.2...
-
The following data have been gathered from two related samples. The differences are assumed to be normally distributed in the population. Use these data and alpha of .01 to test the...
-
Consider the case when the cost function satisfies C xe ( )=0. This can arise for different reasons. Consider the following two possibilities: (a) Suppose production and abatement costs (AC) are...
-
Prepare the income statement for Blue Sea Company in E2- 25A for the most recent year. Assume that the company sold 39,000 units of its product at a price of $ 10 each during the year.
-
Recently, Inditex (ESP) reported ending inventory of 1,581.297 (1,297.009 the previous year). Cost of sales were 6,486.825 and net sales were 15,946.143 (all amounts in millions). Compute Inditex's...
-
Respondents Varsity Brands, Inc., Varsity Spirit Corporation, and Varsity Spirit Fashions & Supplies, Inc., design, make, and sell cheerleading uniforms. Respondents have obtained or acquired more...
-
RiverHawk Expeditions provides guided tours in scenic mountainous areas. After the first 11 months of operations in 2015, RiverHawk has the following account balances. The following transactions...
-
data in Range N 6 : Y 4 3 describes NFL quarterback ( QB ) statistics for the 2 0 1 3 season. Write different formulas for the following questions. Name Team G QBRat Comp Att Pct Yds Y / G Y / A TD...
-
The Classic Furniture Company is trying to determine the optimal quantities to make of six possible products: tables and chairs made of oak, cherry, and pine. The products are to be made using the...
-
Multinational companies generally provide an allowance for personal entertainment for executives living overseas. Assume that 18% of Canadian-based multinational companies provide such an allowance....
-
Problem 11.16 analyzed the number of hours worked per week per person at five different plants. An F value of 3.10 was obtained with a probability of 0.0266. Because the probability is less than...
-
Consider a college organization with which you are familiar. How did management issues affect strategy implementation in that organization?
-
If you live outside the limits of a city in Texas, water, sewer, sanitation, and electricity services are offered by Question 5 options: a) auxiliary utility districts (AUDs). b) federal utility...
-
(b) Use MATLAB to calculate &=y-X(XX)'X'y and ', where 1 X 1-1-1 - 10 1 1 -1 -1 20 1 - -1 15 1 - -1 and 13 y 1 1 1 -1 - - 1 23 1 24 1 28 11 1 16 Show your final results of and ', as well as the...
-
Let A be the matrix 1 1 1 -2 0-3 4 0 6.5 (a) Let = [100], = [010] and d = [001]. Use Gauss-Jordan elimination, solve the three equations Ax = 6, Ay = and Az = d to find x, y and z. (b) Hence, or...
-
Briefly explain the meaning of moral hazard, and identify two ways in which an insurer can design a policy covering theft to reduce the risk of moral hazard
-
2] Merrick goes to the farmer's market to buy exotic fruit. Last week, he bought 15 rambutan at 20 cents each. This week, rambutan prices increased to 30 cents each, and Merrick buys only 10 rambutan...
-
Suppose you are testing the following hypotheses: H0: = 1000 Ha : 1000 Sample size is 36. The sample mean is 940. The population standard deviation is 120. The significance level is .05. a. What are...
-
3.16. For a system with non-identical service rates (see Sect. 3.5) and a limit of N jobs in the system (Eq. 3.13), obtain an expression for the mean service time per job, E[Ts], as a function of the...
-
Shown here is Minitab output for a Friedman test. Friedman Test: Observations Versus Treatment Blocked by Block Discuss the experimental design and the outcome of theexperiment. S13.71 DF4 P0.009 Sum...
-
Compute a Spearmans rank correlation for the following variables to determine the degree of association between the two variables. x y 23 .......201 41 .......259 37 .......234 29 .......240 25...
-
The following data are the ranks for values of the two variables, x and y. Compute a Spearman's rank correlation to determine the degree of relation between the twovariables. ! 2 3114 x-31296...
-
The following balances were drawn from the accounts of Carter Company. The accounts and balances shown here are presented in random order: Equipment-$14,000; Cash-$25,000; Depreciation...
-
Pension data for Fahy Transportation Incorporated include the following: Discount rate, 9% Expected return on plan assets, 12% Actual return on plan assets, 13% Projected benefit obligation, January...
-
Robinson Products Company has two service departments (S1 and S2) and two production departments (P1 and P2). The distribution of each service department's efforts (in percentages) to the other...
Study smarter with the SolutionInn App