

Question: Take the first 10 observations in Table 13.1 and perform a multiple regression on these data. What is the R 2 ? How much of
Take the first 10 observations in Table 13.1 and perform a multiple regression on these data. What is the R2? How much of this R2 can be attributed to chance?
Data from table 13.1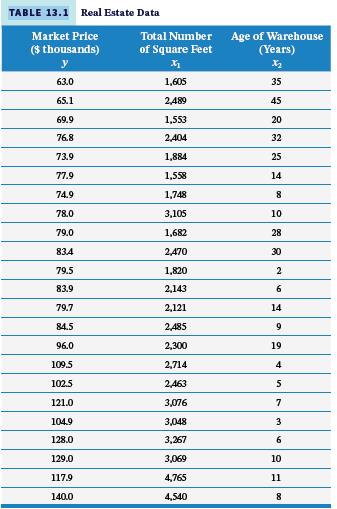
TABLE 13.1 Real Estate Data Market Price ($ thousands) 63.0 65.1 69.9 76.8 73.9 77.9 74.9 78.0 79.0 834 79.5 83.9 79.7 84.5 96.0 109.5 102.5 121.0 104.9 128.0 129.0 117.9 140.0 Total Number of Square Feet X1 1,605 2,489 1,553 2,404 1,884 1,558 1,748 3,105 1,682 2,470 1,820 2,143 2,121 2,485 2,300 2,714 2,463 3,076 3,048 3,267 3,069 4,765 4,540 Age of Warehouse (Years) 12 35 45 20 32 25 14 8 10 28 30 2 6 14 9 19 4 5 7 3 6 10 11 8
Step by Step Solution
3.41 Rating (164 Votes )
There are 3 Steps involved in it
Using the first 10 observations in Table 131 a multiple regression analysis can ... View full answer

Get step-by-step solutions from verified subject matter experts