

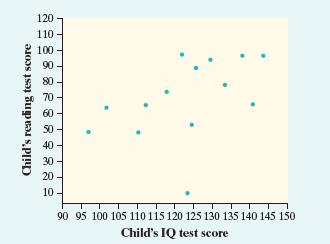
Question: The figure below is a scatterplot of reading test scores against IQ test scores for 14 fifth-grade children. There is one low outlier in the
The figure below is a scatterplot of reading test scores against IQ test scores for 14 fifth-grade children.
There is one low outlier in the plot. What effect does this low outlier have on the correlation?
(a) It makes the correlation closer to 1.
(b) It makes the correlation closer to 0 but still positive.
(c) It makes the correlation equal to 0.
(d) It makes the correlation negative.
(e) It has no effect on the correlation.
Child's reading test score 80 70 88882 8 8 9 8 8 2 120 110 100 60 90 95 100 105 110 115 120 125 130 135 140 145 150 Child's IQ test score
Step by Step Solution
There are 3 Steps involved in it
1 Expert Approved Answer
Step: 1 Unlock

Question Has Been Solved by an Expert!
Get step-by-step solutions from verified subject matter experts
Step: 2 Unlock
Step: 3 Unlock