

Question: The residual diagnostics for the multiple regression analysis for the data given in Problem 13.32 follow. Discuss any potential problems with meeting the regression assumptions
The residual diagnostics for the multiple regression analysis for the data given in Problem 13.32 follow. Discuss any potential problems with meeting the regression assumptions for this regression analysis based on the residual graphics.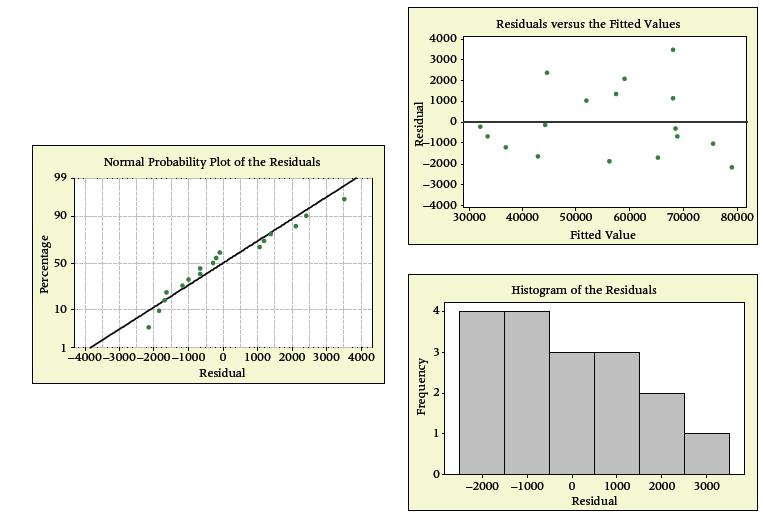
Data from Problem 13.32
The table below shows the growth of new car dealers over a 17-year period. Use the data to predict the number of new car dealers on the basis of the amount spent on used vehicles and parts, total excluding vehicles and parts, and gasoline stations. Discuss the results, highlighting both the significant and nonsignificant predictors.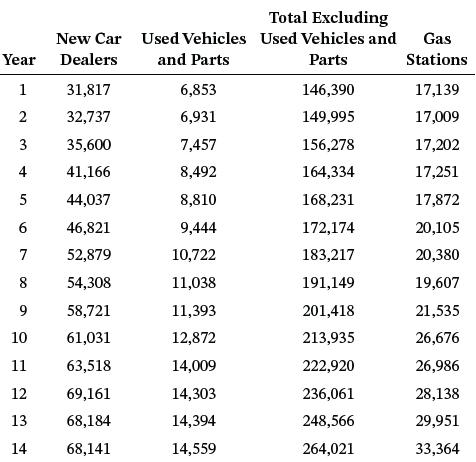
Percentage 99 90 50 10 1 Normal Probability Plot of the Residuals -4000-3000-2000-1000 0 1000 2000 3000 4000 Residual Residual 4000 3000 2000 1000 0 -1000 -2000 -3000 -4000 Frequency W N 1 0 30000 Residuals versus the Fitted Values 40000 50000 60000 70000 80000 Fitted Value Histogram of the Residuals -2000 -1000 0 1000 2000 Residual 3000
Step by Step Solution
3.45 Rating (164 Votes )
There are 3 Steps involved in it

Get step-by-step solutions from verified subject matter experts