

Question: Use the data from Problem 2.34.a. Construct a histogram and a frequency polygon.b. Construct an ogive. Data from Problem 2.34 A distribution company in Alberta
Use the data from Problem 2.34.a. Construct a histogram and a frequency polygon.b. Construct an ogive.
Data from Problem 2.34
A distribution company in Alberta surveyed 53 of its midlevel managers. The survey obtained the ages of these managers, which were later organized into the frequency distribution shown. Determine the class midpoint, relative frequency, and cumulative frequency for these data.
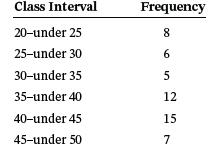
Class Interval 20-under 25 25-under 30 30-under 35 35-under 40 40-under 45 45-under 50 Frequency 8 6 5 12 15 7 00
Step by Step Solution
3.26 Rating (152 Votes )
There are 3 Steps involved in it
a Histogram and a Frequency Polygon ... View full answer

Get step-by-step solutions from verified subject matter experts