

A new airport terminal has been assessing waiting times for passengers to be processed at the airport
Question:
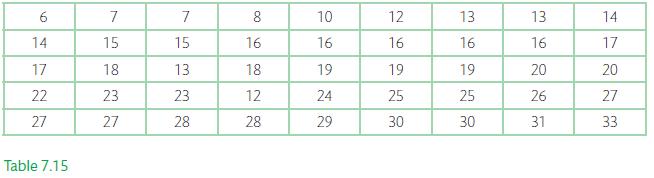
A new airport terminal has been assessing waiting times for passengers to be processed at the airport check-in counters. The airport owners would like to be able to attach levels of risk to diff erent aspects of the business. To undertake this we are required to fit an appropriate probability distribution to the observed frequencies provided in Table 7.15.
(a) Use the data in Table 7.15 to provide an estimate of the population mean and standard deviation;
(b) Construct a z distribution table with upper class boundaries of 14, 17, 22, 26, and infinity;
(c) Use this table to calculate the cumulative distribution function values at these class boundaries based on your answers to parts (a)–(b); (d) estimate the class probabilities and resultant expected frequencies;
(e) Calculate the observed frequencies based upon your upper class boundaries;
(f) Undertake a chi-square goodness-of-fit test to assess at a 95% confidence that the normal distribution would be a good fi t to the sample data.
Step by Step Answer:


