

Question: Camp sites Shown below are the histogram and summary statistics for the number of camp sites at public parks in Vermont. a) Which statistics would
Camp sites Shown below are the histogram and summary statistics for the number of camp sites at public parks in Vermont.
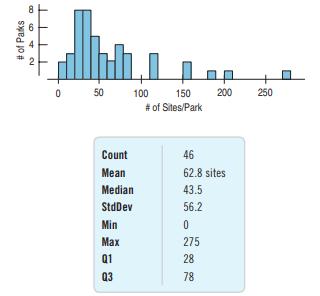
a) Which statistics would you use to identify the center and spread of this distribution? Why?
b) How many parks would you classify as outliers? Explain.
c) Create a boxplot for these data.
d) Write a few sentences describing the distribution.
00 64 # of Parks 2 0 50 100 150 200 250 # of Sites/Park Count 46 Mean 62.8 sites Median 43.5 StdDev 56.2 Min 0 Max 275 Q1 28 Q3 78
Step by Step Solution
There are 3 Steps involved in it
1 Expert Approved Answer
Step: 1 Unlock

Question Has Been Solved by an Expert!
Get step-by-step solutions from verified subject matter experts
Step: 2 Unlock
Step: 3 Unlock