

Question: Construct a scatter plot for the data in Table 8.4 and calculate Pearsons correlation coefficient, r. Comment on the strength of the correlation between x
Construct a scatter plot for the data in Table 8.4 and calculate Pearson’s correlation coefficient, r. Comment on the strength of the correlation between x and y.
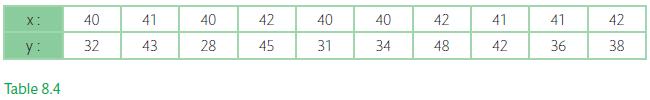
X: y: Table 8.4 40 32 41 43 40 28 42 45 40 31 40 34 42 48 41 42 41 36 42 38
Step by Step Solution
★★★★★
3.31 Rating (157 Votes )
There are 3 Steps involved in it
1 Expert Approved Answer
Step: 1 Unlock

The scatter plo... View full answer
Question Has Been Solved by an Expert!
Get step-by-step solutions from verified subject matter experts
Step: 2 Unlock
Step: 3 Unlock