

Figure 9.31 shows how the moving averages were calculated for a three point moving average (3MA) and
Question:
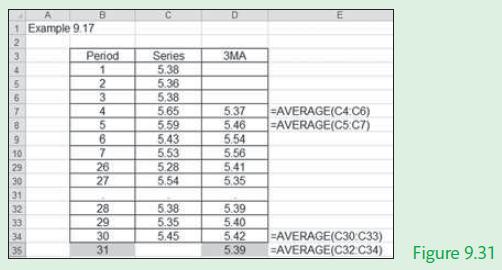
Figure 9.31 shows how the moving averages were calculated for a three point moving average (3MA) and the use of the model to provide a forecast at time point 31.
Fantastic news! We've Found the answer you've been seeking!
Step by Step Answer:
Excel solution Period Cells B4B34 Ser...View the full answer

Answered By
Salmon ouma
I am a graduate of Maseno University, I graduated with a second class honors upper division in Business administration. I have assisted many students with their academic work during my years of tutoring. That has helped me build my experience as an academic writer. I am happy to tell you that many students have benefited from my work as a writer since my work is perfect, precise, and always submitted in due time. I am able to work under very minimal or no supervision at all and be able to beat deadlines.
I have high knowledge of essay writing skills. I am also well conversant with formatting styles such as Harvard, APA, MLA, and Chicago. All that combined with my knowledge in methods of data analysis such as regression analysis, hypothesis analysis, inductive approach, and deductive approach have enabled me to assist several college and university students across the world with their academic work such as essays, thesis writing, term paper, research project, and dissertation. I have managed to help students get their work done in good time due to my dedication to writing.
4+ Reviews
16+ Question Solved
Related Book For 

Question Posted:
