

Question: Population growth 2010 This back-to-back stem-andleaf plot displays two data sets at onceone going to the left, one to the right. The plot compares the
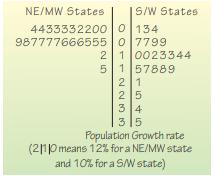
Population growth 2010 This “back-to-back” stem-andleaf plot displays two data sets at once—one going to the left, one to the right. The plot compares the percent change in population for two regions of the United States (based on census figures for 2000 and 2010). The fastest growing state was Nevada at 35%. To show the distributions better, this display breaks each stem into two lines, putting leaves 0–4 on one stem and leaves 5–9 on the other.
a) Use the data displayed in the stem-and-leaf display to construct comparative boxplots.
b) Write a few sentences describing the difference in growth rates for the two regions of the United States.
NE/MW States S/W States 4433332200 0 134 987777666555 0 7799 2 1 0023344 5 1 57889 2 1 25 34 315 Population Growth rate (210 means 12% for a NE/MW state and 10% for a S/W state)
Step by Step Solution
There are 3 Steps involved in it

Get step-by-step solutions from verified subject matter experts