

Question: Use the Excel TREND() function to fit a trend line to the Example 8.1 data set, as illustrated in Figure 8.20. Data from Example 8.1
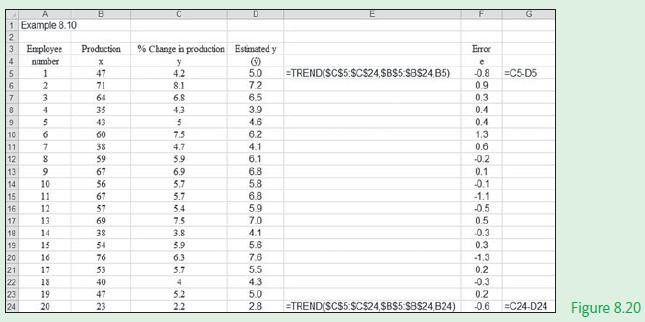
Use the Excel TREND() function to fit a trend line to the Example 8.1 data set, as illustrated in Figure 8.20.
Data from Example 8.1
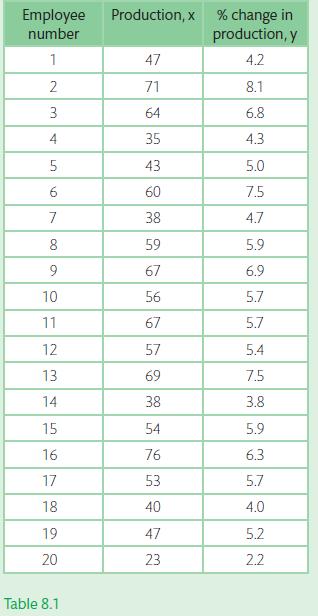
A large manufacturing firm with some 8000 employees has designed a training programme that is supposed to increase the production of employees. The personnel manager decides to examine this claim by analysing the data results from the first group of 20 employees that attended the course.
Table 8.1 provides the data set for the % change in production (y) measured against a range of production values (x).
A 1 Example 8.10 4 5 6 Employee number 1 17 18 19 20 2 3 4 5 7 8 9 10 11 12 13 14 15 11 16 12 678 9 GUNNS 10 13 14 HEERL8 15 16 17 21 22 23 19 24 18 20 B Production *F3855555558 47 71 64 43 60 59 67 56 67 57 69 54 76 40 47 23 % Change in production Estimated y y 4.2 8.1 6.8 4.3 5 7.5 4.7 5.9 kunn 6.9 5,7 5.7 5.4 7.5 3.8 5.9 6.3 5.7 4 5.2 2.2 5.0 -TREND(SC$5:$C$24,$B$5:$B$24,B5) 25982N-B0000-co 72 6.5 3.9 4.6 6.2 4.1 6.1 6.8 5.8 6.8 5.9 7.0 4.1 5.6 7.8 5.5 4.3 5.0 2.8 =TREND(SC$5:$C$24,$B$5:$B$24,B24) Error e -0.8 =C5-D5 0.9 AMAA no 50086-808 0.3 0.4 0.4 1.3 0.6 -0.2 0.1 -0.1 -90 -1.1 -0.5 0.5 0.3 0.3 G -1.3 0.2 -0.3 0.2 =C24-024 Figure 8.20
Step by Step Solution
3.46 Rating (162 Votes )
There are 3 Steps involved in it
Excel solution x Cells B5B24 y Cell... View full answer

Get step-by-step solutions from verified subject matter experts