

Question: (a) How many variables are included in the scatterplot in Figure 2.84(a)? Identify each as categorical or quantitative. Estimate the range for Variable1 and for
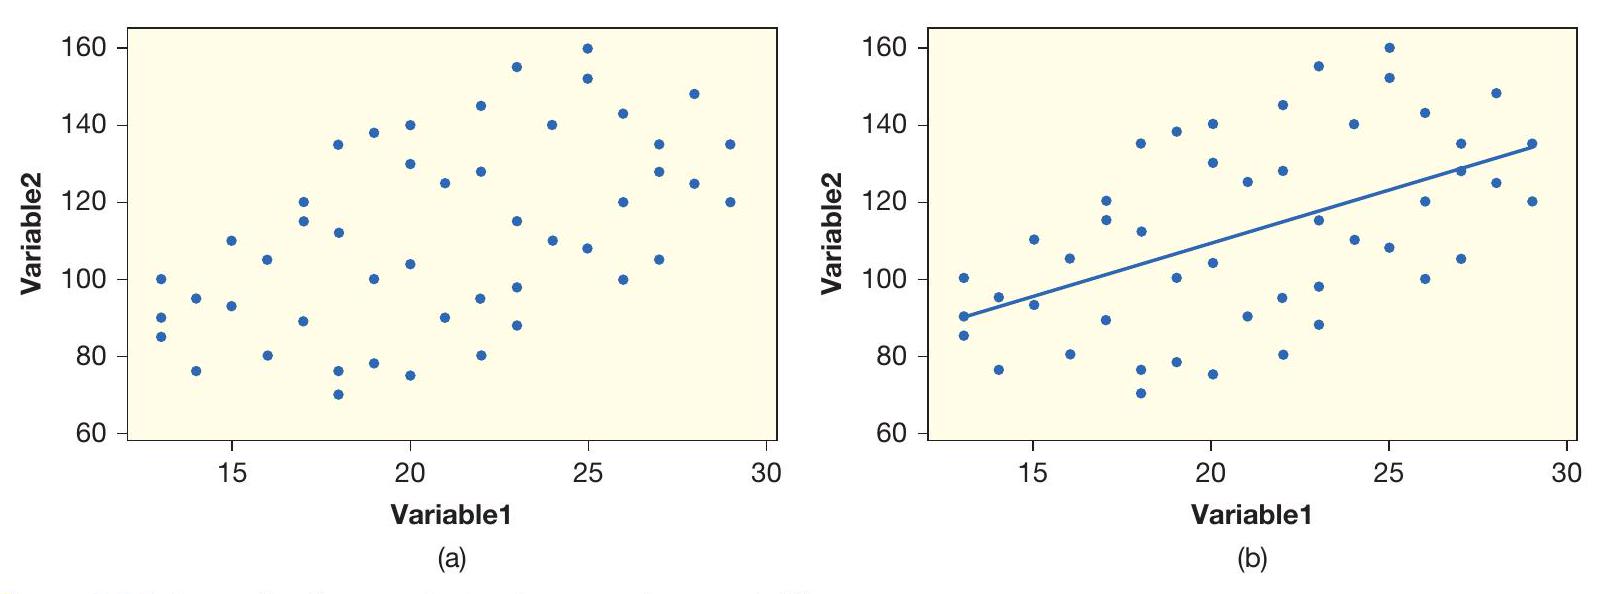
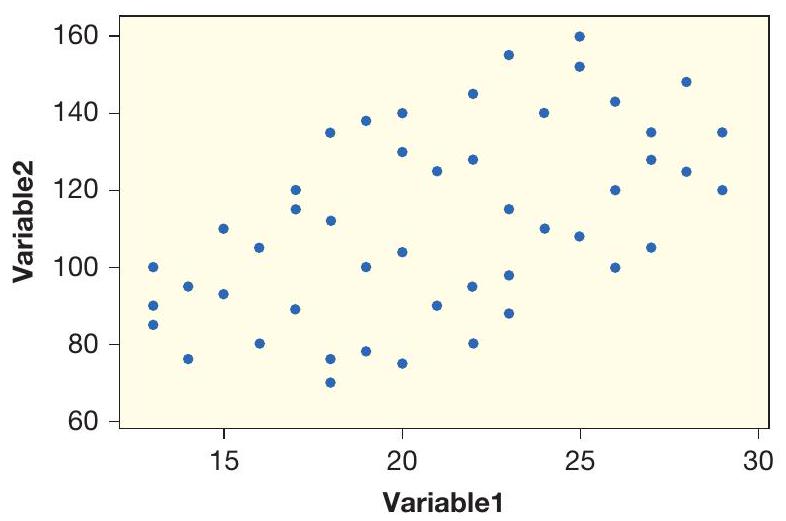
(a) How many variables are included in the scatterplot in Figure 2.84(a)? Identify each as categorical or quantitative. Estimate the range for Variable1 and for Variable2.
(b) In Figure 2.84(a), does the association between the variables appear to be positive or negative?
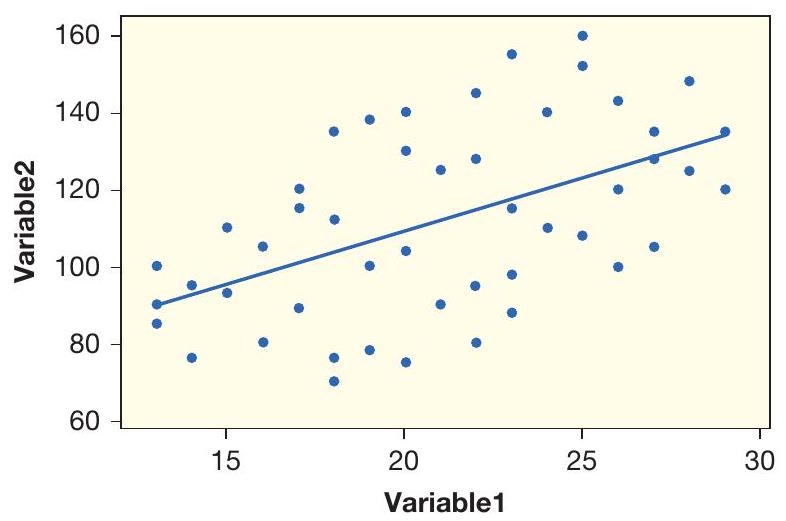
(c) Figure 2.84 (b) shows the same scatterplot with regression line added. Which variable is the
(a)
(b)
Figure 2.84 Describe the association between these variables response variable? Does the line show a positive or negative association?
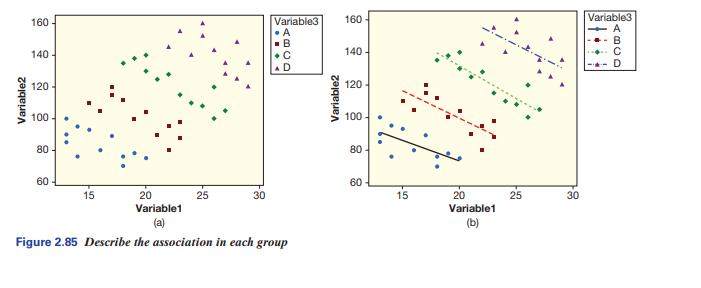
(d) Figure 2.85 (a) shows the same scatterplot with a third variable included. Is the new variable categorical or quantitative? If categorical, how many categories? If quantitative, estimate the range.
(e) In Figure 2.85(a), if we only consider cases in Group A, does the association between Variable1 and Variable2 appear to be positive or negative? How about in Group B? Group C? Group D?
(f) Figure 2.85 (b) shows the same scatterplot as Figure 2.85 (a) with regression lines added within each of the four groups. Does the regression line for Group A show a positive or negative association? How about Group B? Group C? Group D?
(g) What happens to the direction of association shown in Figure 2.84 when we add the additional information contained in Variable3 as in Figure 2.85? (This is an example of Simpson's Paradox for quantitative variables.)
Variable2 160 140 120 100 80 60 60 60 15 20 Variable1 (a) 25 Variable2 140 160 120 100 80 60 I T 30 30 15 20 25 30 40 Variable1 (b)
Step by Step Solution
There are 3 Steps involved in it

Get step-by-step solutions from verified subject matter experts