

A matrix of scatterplots is a good way to examine data like this. Select Matrix Plot. .
Question:
A matrix of scatterplots is a good way to examine data like this.
Select Matrix Plot. . . from the Graph menu. Click on Matrix of Plots, With Groups which is the second option on the top row of the dialog box. Click on OK. Enter Mn-Ti or c3-c7 into the Graph variables: text box. Enter Part Number or c2 c1 into the Categorical variables for grouping (0{3): text box, and click on OK.
[R:] Type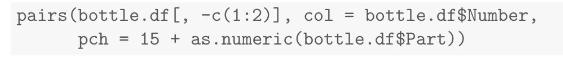
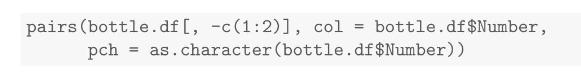
It should be very clear from this plot that one bottle seems quite different from the others. We can see from the legend in Minitab that this is bottle number 5. We can do this in R by changing the plotting symbol to the bottle number. This is done by altering the second line of code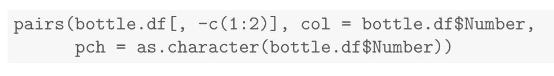
Step by Step Answer:

This question has not been answered yet.
You can Ask your question!

Introduction To Bayesian Statistics
ISBN: 9781118091562
3rd Edition
Authors: William M. Bolstad, James M. Curran
