

Question: Consider the following 10 data points. a. Plot the data on a scatterplot. b. Calculate the values of r and r2. c. Is there sufficient
Consider the following 10 data points.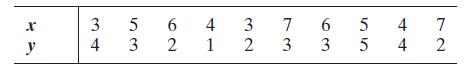
a. Plot the data on a scatterplot.
b. Calculate the values of r and r2.
c. Is there sufficient evidence to indicate that x and y are linearly correlated? Test at the a = .10 level of significance.
3 5 6 4 3 7 6 y 4 3 2 1 2 3 3 55 5 4 7 42
Step by Step Solution
There are 3 Steps involved in it
1 Expert Approved Answer
Step: 1 Unlock

Question Has Been Solved by an Expert!
Get step-by-step solutions from verified subject matter experts
Step: 2 Unlock
Step: 3 Unlock