

Question: Consider the following pairs of measurements. a. Construct a scatterplot of these data. b. What does the scatterplot suggest about the relationship between x and
Consider the following pairs of measurements.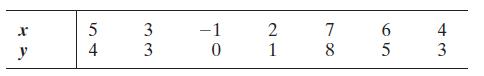
a. Construct a scatterplot of these data.
b. What does the scatterplot suggest about the relationship between x and y?
c. Given that SSxx = 43.4286, SSxy = 39.8571, y = 3.4286, and x = 3.7143, calculate the least squares estimates of b0 and b1.
d. Plot the least squares line on your scatterplot. Does the line appear to fit the data well? Explain.
e. Interpret the y-intercept and slope of the least squares line. Over what range of x are these interpretations meaningful?
y r 54 33 -1 2 0 1 78 65 43
Step by Step Solution
There are 3 Steps involved in it
1 Expert Approved Answer
Step: 1 Unlock

Question Has Been Solved by an Expert!
Get step-by-step solutions from verified subject matter experts
Step: 2 Unlock
Step: 3 Unlock