

Question: Consider the following pairs of observations: a. Construct a scatterplot of the data. b. Use the method of least squares to fit a straight line
Consider the following pairs of observations: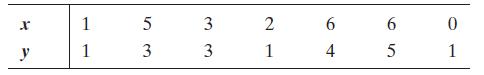
a. Construct a scatterplot of the data.
b. Use the method of least squares to fit a straight line to the seven data points in the table.
c. Plot the least squares line on your scatterplot of part a.
d. Specify the null and alternative hypotheses you would use to test whether the data provide sufficient evidence to indicate that x contributes information for the (linear)
prediction of y.
e. What is the test statistic that should be used in conducting the hypothesis test of part d? Specify the number of degrees of freedom associated with the test statistic.
f. Conduct the hypothesis test of part
d, using a = .05.
g. Construct a 95% confidence interval for b1.
x 1 y 1 53 33 64 2 21 1 6 65 0 1
Step by Step Solution
There are 3 Steps involved in it

Get step-by-step solutions from verified subject matter experts