

Exercise 2.229 plotted the Golden State Warriors point differential, Golden State points - Opponent points, each minute
Question:
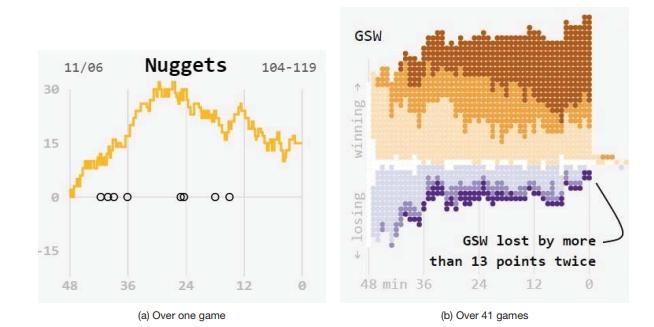
Exercise 2.229 plotted the Golden State Warriors point differential, Golden State points - Opponent points, each minute of one game during their record breaking 2015-2016 season. Adam Pearce of roadtolarissa.com also plotted the game state (winning or losing or tied) every minute of every game over the first half of the Warriors season in Figure 2.91(b). Within this plot each orange dot above 0 indicates a game where they were winning at that minute (point differential above 0 ), and each purple dot below 0 indicates a game where they were losing (point differential below 0 ) at that minute. The darkness of the dot indicates how far the point differential was above or below 0 .
(a) How many games were the Warriors losing at the 24-minute mark (halftime)?
(b) How many games were the Warriors losing at the 0 -minute mark (the end of the game)?
Data From Exercise 2.229:
Golden State Warriors: One Game During a record breaking season the Golden State Warriors of the National Basketball Association (NBA) won 24 straight games to start the 2015-2016 season. Adam Pearce plotted the point differential, Golden State points - Opponent points, each minute of the first 16 games of the streak. One of those games, a 119 to 104 victory on November 6th, is plotted in Figure 2.91(a).
Figure 2.91:
Step by Step Answer:

This question has not been answered yet.
You can Ask your question!


Statistics, Enhanced Unlocking The Power Of Data
ISBN: 9781119308843
2nd Edition
Authors: Robin H Lock, Patti Frazer Lock, Kari Lock Morgan, Eric F Lock, Dennis F Lock
