

Question: Figure 9.11 shows a scatterplot and regression line of the relationship between the between distance walked, in metres on an endurance shuttle walk test before
Figure 9.11 shows a scatterplot and regression line of the relationship between the between distance walked, in metres on an endurance shuttle walk test before (pre) and after (post) a physiotherapy rehabilitation programme in 100 patients with Chronic Obstructive Pulmonary (COPD) disease.
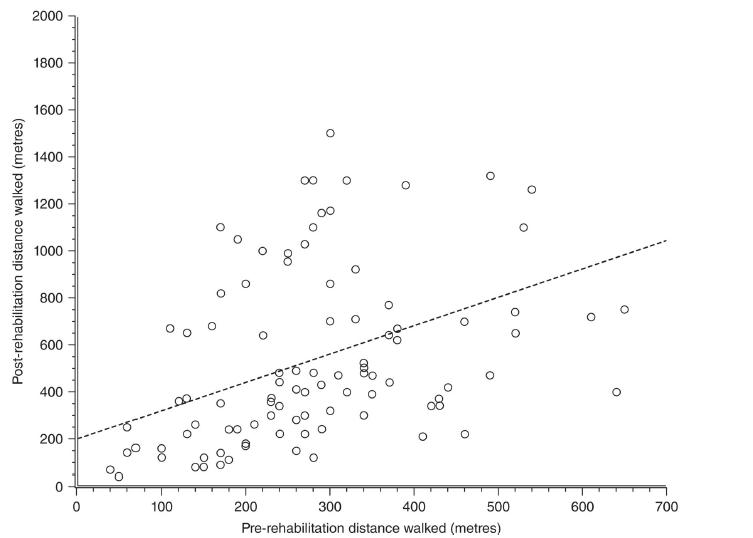
Figure 9.11 Scatterplot and regression line of the relationship between the between distance walked, in metres on an endurance shuttle walk test before (pre) and after
(post) a physiotherapy rehabilitation programme in 100 patients with Chronic Obstructive Pulmonary (COPD) disease.
From Figure 9.11, what do you think is the approximate correlation between pre and post rehabilitation distance walked?
A. −1.0 B. −0.5 C. 0.0 D. 0.4 E. 0.8
2000 1800 1600 1400 1200 1000 Post-rehabilitation distance walked (metres) 800 600 400 200 0 8 8 8 300 400 500 600 700 Pre-rehabilitation distance walked (metres) 100 200
Step by Step Solution
3.37 Rating (156 Votes )
There are 3 Steps involved in it
D It is a po... View full answer

Get step-by-step solutions from verified subject matter experts