

Fill in the blanks on the graph with the areas, upper and lower limits of the confidence
Question:
Fill in the blanks on the graph with the areas, upper and lower limits of the confidence interval, and the sample mean.
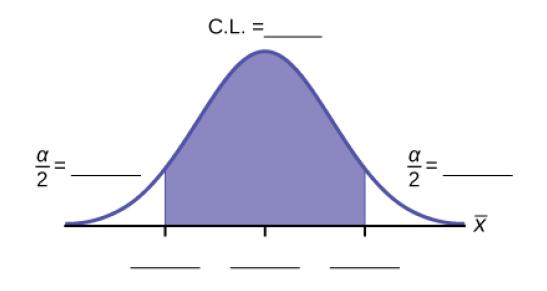
The mean age for all Foothill College students for a recent Fall term was 33.2. The population standard deviation has been pretty consistent at 15. Suppose that twenty-five Winter students were randomly selected. The mean age for the sample was 30.4. We are interested in the true mean age for Winter Foothill College students. Let X = the age of a Winter Foothill College student.
Construct a 95% Confidence Interval for the true mean age of Winter Foothill College students by working out then.
Step by Step Answer:

This question has not been answered yet.
You can Ask your question!
Related Book For 

Introductory Business Statistics
ISBN: 202318
1st Edition
Authors: Alexander Holmes , Barbara Illowsky , Susan Dean
Question Posted:
