

Question: From Exercise 1, we also have data on how long each person has been with the company (tenure) categorized into three levels: less than one
From Exercise 1, we also have data on how long each person has been with the company (tenure) categorized into three levels: less than one year, between one and five years, and more than five years. A table of the two variables together looks like this:
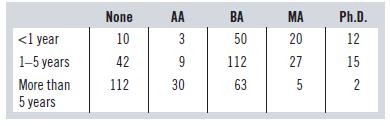
a) Find the marginal distribution of the tenure. (Hint: Find the row totals.)
b) Verify that the marginal distribution of the education level is the same as that given in Exercise 1.
None AA BA MA Ph.D.
Step by Step Solution
There are 3 Steps involved in it
1 Expert Approved Answer
Step: 1 Unlock

Question Has Been Solved by an Expert!
Get step-by-step solutions from verified subject matter experts
Step: 2 Unlock
Step: 3 Unlock