

Question: From the Table 9.10 and the model what is the proportion of the variability in the outcome, postrehabilitation distance walked, which is NOT explained by
From the Table 9.10 and the model what is the proportion of the variability in the outcome, post‐rehabilitation distance walked, which is NOT explained by age, gender and pre‐treatment distance walked?
A. 0.10 B. 0.20 C. 0.40 D. 0.60 E. 0.80
Table 9.10
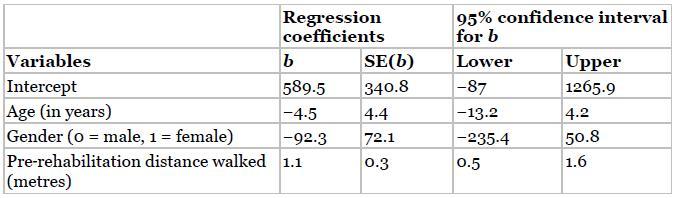
Variables Intercept Age (in years) Gender (o male, 1 = = female) Pre-rehabilitation distance walked (metres) Regression 95% confidence interval coefficients for b b SE(b) Lower Upper 589.5 340.8 -87 1265.9 -4.5 4.4 -13.2 4.2 -92.3 72.1 -235-4 50.8 1.1 0.3 0.5 1.6
Step by Step Solution
There are 3 Steps involved in it
E The R2 value is 020 ... View full answer

Get step-by-step solutions from verified subject matter experts