

Question: Graph the situation. Label and scale the horizontal axis. Mark the mean and test statistic. Shade in the region corresponding to the confidence level. Let
Graph the situation. Label and scale the horizontal axis. Mark the mean and test statistic. Shade in the region corresponding to the confidence level.

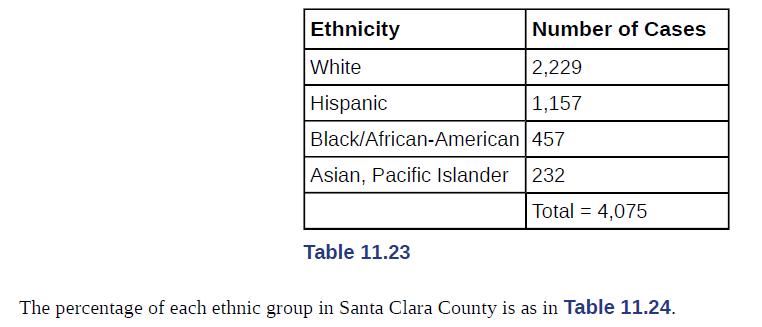
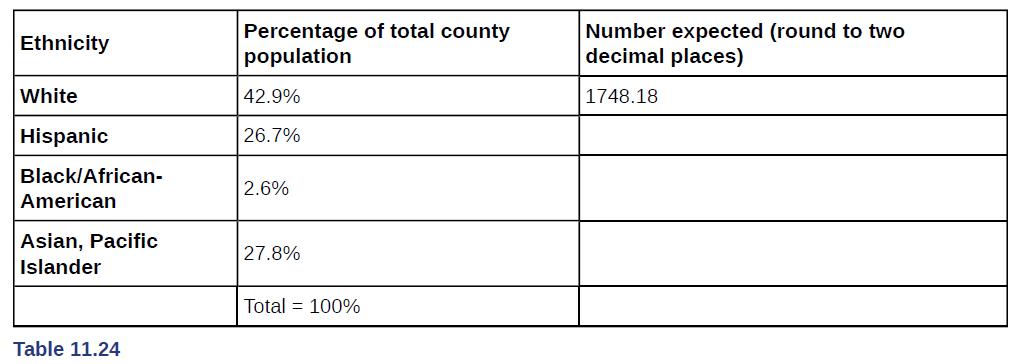
Let α = 0.05 Decision: ________________ Reason for the Decision: ________________ Conclusion (write out in complete sentences): ________________ The following data are real. The cumulative number of AIDS cases reported for Santa Clara County is broken down by ethnicity as in Table 11.23.
Step by Step Solution
★★★★★
3.36 Rating (146 Votes )
There are 3 Steps involved in it
1 Expert Approved Answer
Step: 1 Unlock

Graph Check students solution Decision Cannot accept the null hyp... View full answer
Question Has Been Solved by an Expert!
Get step-by-step solutions from verified subject matter experts
Step: 2 Unlock
Step: 3 Unlock