

Question: Here is a scatterplot of the residuals for the linear model found in For Example: A linear model for retail expansion across Canada plotted against
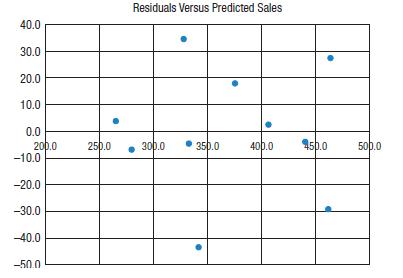
Here is a scatterplot of the residuals for the linear model found in For Example: “A linear model for retail expansion across Canada” plotted against the predicted values:
QUESTION:
Show how the plotted values were calculated. What patterns do you see in the plot? What conclusions do you draw?
40.0 30.0 20.0 Residuals Versus Predicted Sales 10.0 0.0 200.0 250.0 300.0 350.0 400.0 450.0 500.0 -10.0 -20.0 -30.0 -40.0 -50.0
Step by Step Solution
There are 3 Steps involved in it
1 Expert Approved Answer
Step: 1 Unlock

The residuals are the values of Act... View full answer
Question Has Been Solved by an Expert!
Get step-by-step solutions from verified subject matter experts
Step: 2 Unlock
Step: 3 Unlock