

Question: Using the data in Table 11.4 calculate the missing upper and lower limits for the 95% confidence interval estimate for the Hazard Ratio (the PIG
Using the data in Table 11.4 calculate the missing upper and lower limits for the 95% confidence interval estimate for the Hazard Ratio (the PIG vs PEG variable/row) for cells ZZ and ZZZZ.
A. 0.58 to 1.02
B. 0.74 to 2.69
C. 0.88 to 1.05
D. 0.39 to 0.72
E. 0.29 to 1.71
Table 11.4
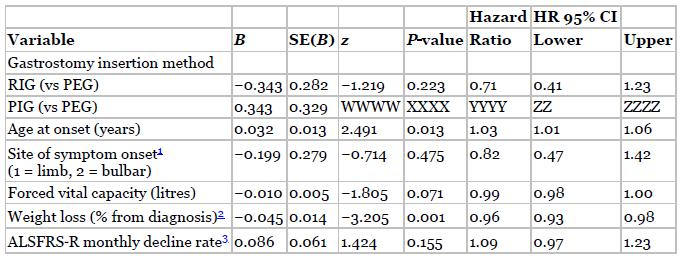
Variable Gastrostomy insertion method B SE(B) z P-value Ratio Hazard HR 95% CI Lower Upper RIG (vs PEG) -0.343 0.282 -1.219 PIG (vs PEG) 0.343 0.329 Age at onset (years) 0.223 WWWW XXXX 0.032 0.013 2.491 0.013 1.03 0.71 YYYY 0.41 1.23 ZZ ZZZZ 1.01 1.06 Site of symptom onset (1=limb, 2 bulbar) Forced vital capacity (litres) Weight loss (% from diagnosis)2 -0.045 0.014 -3.205 ALSFRS-R monthly decline rate3 0.086 0.061 1.424 -0.199 0.279-0.714 0.475 0.82 0.47 1.42 -0.010 0.005 -1.805 0.071 0.99 0.98 1.00 0.001 0.96 0.93 0.98 0.155 1.09 0.97 1.23
Step by Step Solution
3.47 Rating (154 Votes )
There are 3 Steps involved in it
B The 95 CI for the HR i... View full answer

Get step-by-step solutions from verified subject matter experts