

Question: Using the same X , s x , and n = 39, how would the error bound change if the confidence level were reduced to
Using the same X̅ , sx , and n = 39, how would the error bound change if the confidence level were reduced to 90%?
Why?
The data in Table 8.2 are the result of a random survey of 39 national flags (with replacement between picks) from various countries. We are interested in finding a confidence interval for the true mean number of colors on a national flag. Let X = the number of colors on a national flag.
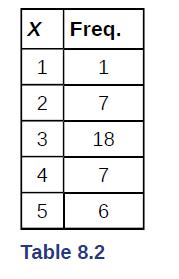
X Freq. 1 1 2 7 3 18 4 7 5 6 Table 8.2
Step by Step Solution
There are 3 Steps involved in it
1 Expert Approved Answer
Step: 1 Unlock

Question Has Been Solved by an Expert!
Get step-by-step solutions from verified subject matter experts
Step: 2 Unlock
Step: 3 Unlock