

Question: Each ordered pair gives the average weekly wage x for federal government workers and the average weekly wage y for state government workers for 2001
Each ordered pair gives the average weekly wage x for federal government workers and the average weekly wage y for state government workers for 2001 through 2009.
(a) Plot the data. From the graph, do the data appear to be approximately linear?
(b) Visually find a linear model for the data. Graph the model.
(c) Use the model to approximate y when x = 1075.
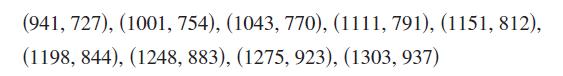
(941, 727), (1001, 754), (1043, 770), (1111, 791), (1151, 812), (1198, 844), (1248, 883), (1275, 923), (1303, 937)
Step by Step Solution
3.47 Rating (157 Votes )
There are 3 Steps involved in it
a and b Yes the data appear ... View full answer

Get step-by-step solutions from verified subject matter experts