

Question: In Exercises the graph of a velocity function is shown. It represents the velocity in miles per hour during a 10-minute trip to work. Make
In Exercises the graph of a velocity function is shown. It represents the velocity in miles per hour during a 10-minute trip to work. Make a sketch of the corresponding position function.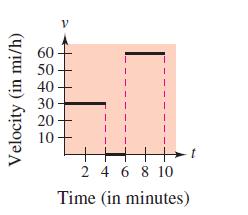
Velocity (in mi/h) 60 50 40 30 20 10 V I I 2 4 6 8 10 Time (in minutes)
Step by Step Solution
★★★★★
3.44 Rating (173 Votes )
There are 3 Steps involved in it
1 Expert Approved Answer
Step: 1 Unlock

This graph corresponds wit... View full answer
Question Has Been Solved by an Expert!
Get step-by-step solutions from verified subject matter experts
Step: 2 Unlock
Step: 3 Unlock