

The data show the per capita energy consumptions (in millions of Btu) and the per capita gross
Question:
The data show the per capita energy consumptions (in millions of Btu) and the per capita gross national incomes (in thousands of U.S. dollars) for several countries in 2008.
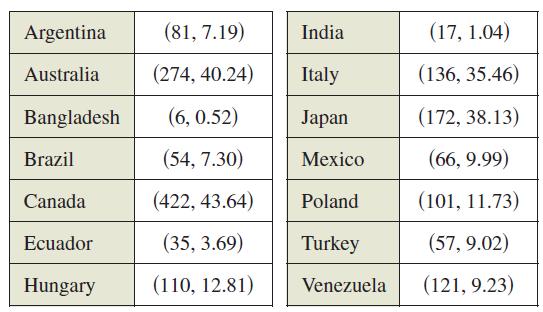
(a) Use the regression capabilities of a graphing utility to find a linear model for the data. What is the correlation coefficient?
(b) Use a graphing utility to plot the data and graph the model.
(c) Interpret the graph in part (b). Use the graph to identify the three countries that differ most from the linear model.
(d) Delete the data for the three countries identified in part (c). Fit a linear model to the remaining data and give the correlation coefficient.
Fantastic news! We've Found the answer you've been seeking!
Step by Step Answer:
a b c Greater per capita energy consumption by a country ...View the full answer

Answered By
Nazrin Ziad
I am a post graduate in Zoology with specialization in Entomology.I also have a Bachelor degree in Education.I posess more than 10 years of teaching as well as tutoring experience.I have done a project on histopathological analysis on alcohol treated liver of Albino Mice.
I can deal with every field under Biology from basic to advanced level.I can also guide you for your project works related to biological subjects other than tutoring.You can also seek my help for cracking competitive exams with biology as one of the subjects.
2+ Reviews
10+ Question Solved
Related Book For 

Question Posted:
