

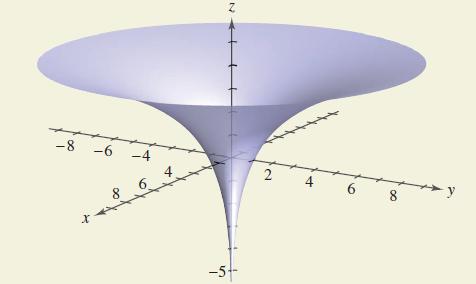
The figure shows the graph of (x, y) = ln x + y. From the graph, does
Question:
The figure shows the graph of ƒ(x, y) = ln x² + y². From the graph, does it appear that the limit at each point exists?
(a) (-1, -1)
(b) (0, 3)
(c) (0, 0)
(d) (2, 0)
Fantastic news! We've Found the answer you've been seeking!
Step by Step Answer:
The limit appears ...View the full answer

Answered By
Dancel Derald Barcelona
I graduated as a civil engineer from one of the prestigious institutes in India with a GPA of 8.34/10. I have cleared the competitive exams like GATE CE, GATE ES, CAT, JEE, KEAM, etc. with a good score. I am working as an engineer in the underground metro for Chennai Metro Rail Limited. Since my college days, I have been a doubt solving expert in Chegg Inc. I have helped lots of students to get higher grades in their respective board examinations.
0 Reviews
10+ Question Solved
Related Book For 

Question Posted:
