

The graph shows the amount of concentrate Q (in pounds) in a solution in a tank at
Question:
The graph shows the amount of concentrate Q (in pounds) in a solution in a tank at time t (in minutes) as a solution with concentrate enters the tank, is well stirred, and is withdrawn from the tank.
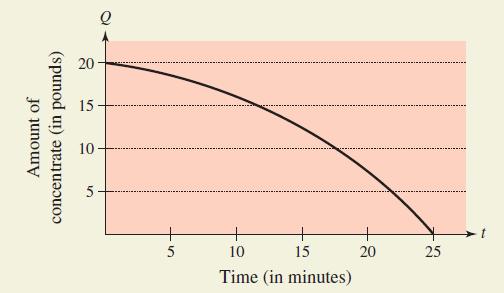
(a) How much concentrate is in the tank at time t = 0?
(b) Which is greater, the rate of solution into the tank, or the rate of solution withdrawn from the tank? Explain.
(c) At what time is there no concentrate in the tank?
What does this mean?
Fantastic news! We've Found the answer you've been seeking!
Step by Step Answer:
a At t 0 Q 20 pounds b T...View the full answer

Answered By
Muqadas Javed
I am a mentor by profession since seven years. I have been teaching on online forums and in universities. Teaching is my passion therefore i always try to find simple solution for complicated problems or task grasp them so that students can easily grasp them.I will provide you very detailed and self explanatory answers and that will help you to get good grade. I have two slogans: quality solution and on time delivery.
24+ Reviews
144+ Question Solved
Related Book For 

Question Posted:
