

The graph shows the flow rate of water at a pumping station for one day. (a) Approximate
Question:
The graph shows the flow rate of water at a pumping station for one day.
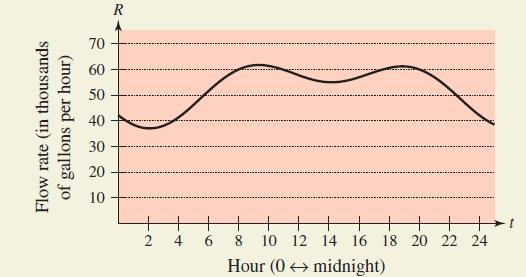
(a) Approximate the maximum flow rate at the pumping station. At what time does this occur?
(b) Explain how you can find the amount of water used during the day.
(c) Approximate the two-hour period when the least amount of water is used. Explain your reasoning.
Fantastic news! We've Found the answer you've been seeking!
Step by Step Answer:
a The maximum flow is approximately R 62 thousand g...View the full answer

Answered By
Nazrin Ziad
I am a post graduate in Zoology with specialization in Entomology.I also have a Bachelor degree in Education.I posess more than 10 years of teaching as well as tutoring experience.I have done a project on histopathological analysis on alcohol treated liver of Albino Mice.
I can deal with every field under Biology from basic to advanced level.I can also guide you for your project works related to biological subjects other than tutoring.You can also seek my help for cracking competitive exams with biology as one of the subjects.
2+ Reviews
10+ Question Solved
Related Book For 

Question Posted:
