

Question: The graph shows the probability density function for a car brand that has a mean fuel efficiency of 26 miles per gallon and a standard
The graph shows the probability density function for a car brand that has a mean fuel efficiency of 26 miles per gallon and a standard deviation of 2.4 miles per gallon.
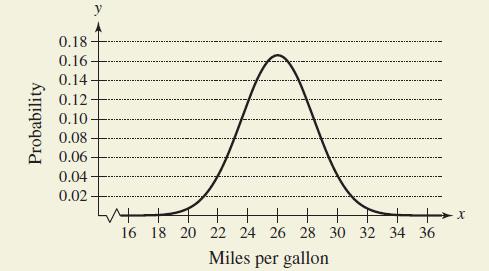
(a) Which is greater, the probability of choosing a car at random that gets between 26 and 28 miles per gallon or the probability of choosing a car at random that gets between 22 and 24 miles per gallon?
(b) Which is greater, the probability of choosing a car at random that gets between 20 and 22 miles per gallon or the probability of choosing a car at random that gets at least 30 miles per gallon?
Probability 0.18 0.16 0.14 0.12 0.10 0.08 0.06 0.04 0.02 y + + + 16 18 20 22 24 26 28 30 32 34 36 Miles per gallon -X
Step by Step Solution
3.47 Rating (160 Votes )
There are 3 Steps involved in it
a The area under the curve is greater on the interval 26 x 28 than on th... View full answer

Get step-by-step solutions from verified subject matter experts