

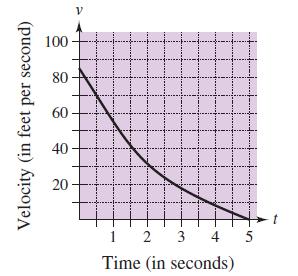
The graph shows the velocity, in feet per second, of a decelerating car after the driver applies
Question:
The graph shows the velocity, in feet per second, of a decelerating car after the driver applies the brakes. Use the graph to estimate how far the car travels before it comes to a stop.
Fantastic news! We've Found the answer you've been seeking!
Step by Step Answer:
5 The distance travel...View the full answer

Answered By
Madhvendra Pandey
Hi! I am Madhvendra, and I am your new friend ready to help you in the field of business, accounting, and finance. I am a College graduate in B.Com, and currently pursuing a Chartered Accountancy course (i.e equivalent to CPA in the USA). I have around 3 years of experience in the field of Financial Accounts, finance and, business studies, thereby looking forward to sharing those experiences in such a way that finds suitable solutions to your query.
Thus, please feel free to contact me regarding the same.
1+ Reviews
10+ Question Solved
Related Book For 

Question Posted:
