

Question: The ordered pairs represent the scores on two consecutive 15-point quizzes for a class of 15 students. (a) Plot the data. From the graph, does
The ordered pairs represent the scores on two consecutive 15-point quizzes for a class of 15 students.
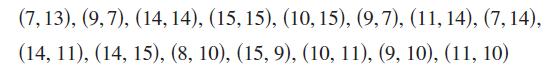
(a) Plot the data. From the graph, does the relationship between consecutive scores appear to be approximately linear?
(b) If the data appear to be approximately linear, find a linear model for the data. If not, give some possible explanations.
(7, 13), (9,7), (14, 14), (15, 15), (10, 15), (9,7), (11, 14), (7, 14), (14, 11), (14, 15), (8, 10), (15, 9), (10, 11), (9, 10), (11, 10)
Step by Step Solution
3.32 Rating (146 Votes )
There are 3 Steps involved in it
a The data do not appear to be linear b Quiz sc... View full answer

Get step-by-step solutions from verified subject matter experts