

Question: Use a graphing utility to find the indicated partial sum S n and complete the table. Then use a graphing utility to graph the first
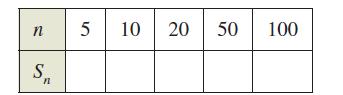
Use a graphing utility to find the indicated partial sum Sn and complete the table. Then use a graphing utility to graph the first 10 terms of the sequence of partial sums. For each series, compare the rate at which the sequence of partial sums approaches the sum of the series.
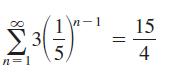
(a)
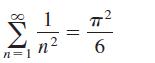
(b)
n S n1 5 10 20 50 100
Step by Step Solution
★★★★★
3.43 Rating (162 Votes )
There are 3 Steps involved in it
1 Expert Approved Answer
Step: 1 Unlock

a b 0 n 20 50 100 Sn ... View full answer
Question Has Been Solved by an Expert!
Get step-by-step solutions from verified subject matter experts
Step: 2 Unlock
Step: 3 Unlock