

Question: Use a graphing utility to make a table showing the values of (x, y) at the given points for each path. Use the result to
Use a graphing utility to make a table showing the values of ƒ(x, y) at the given points for each path. Use the result to make a conjecture about the limit of ƒ(x, y) as (x, y) → (0, 0). Determine analytically whether the limit exists and discuss the continuity of the function.
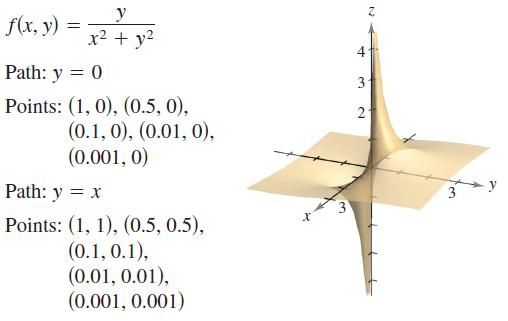
f(x, y) = y x + y Path: y = 0 Points: (1, 0), (0.5, 0), (0.1, 0), (0.01, 0), (0.001, 0) Path: y = x Points: (1, 1), (0.5, 0.5), (0.1, 0.1), (0.01, 0.01), (0.001, 0.001) 3 4 31 2
Step by Step Solution
3.41 Rating (173 Votes )
There are 3 Steps involved in it
fx y x y Continuous except at 0 0 Path y 0 x y fx y 0 10 ... View full answer

Get step-by-step solutions from verified subject matter experts