

Question: (a) Figure 6(A) shows two rectangles whose combined area is an overestimate of the area A under the graph of y = x 2 from
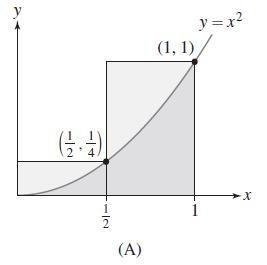
(a) Figure 6(A) shows two rectangles whose combined area is an overestimate of the area A under the graph of y = x2 from x = 0 to x = 1. Compute the combined area of the rectangles.
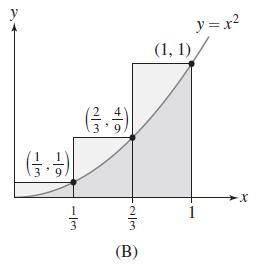
 (b) We can improve the estimate by using three rectangles obtained by dividing [0, 1] into thirds, as shown in Figure 6(B). Compute the combined areas of the three rectangles.
 (c) Now divide [0, 1] into subintervals of width 1/5, and, on a graph of ƒ, sketch the corresponding five rectangles obtained similar to those in (a) and (b). Compute the combined area of the five rectangles to estimate the area A.
(d) Improve your area estimate by dividing [0, 1] into 10 subintervals of width 1/10 and computing the combined area of the 10 resulting rectangles.
By dividing [0, 1] into more and more subintervals, you can improve your estimate. You can use technology to carry out these computations for large numbers of rectangles. The exact value of the area is the limit of the estimates as the number of subintervals gets larger and larger.
Alternatively, for this example there is a formula (that we show how to derive in Section 5.1) that gives the total area A(n) of the rectangles formed when [0, 1] is divided into n subintervals of equal width:
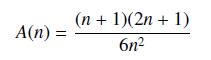
(e) Compute A(n) for n = 2, 3, 5, 10 to verify your results from (a)-(d).
(f) Compute A(n) for n = 100, 1000, and 10,000. Use your results to conjecture what the area A equals.
(2) 12. (A) y=x (1, 1), 1 X
Step by Step Solution
3.49 Rating (166 Votes )
There are 3 Steps involved in it
a The rectangle on the left in Figure 6A has width and height 1 while the rectangle ... View full answer

Get step-by-step solutions from verified subject matter experts