

Question: Figure 18 shows a parametric curve c(t) = (p(t), q(t)) that models the changing population sizes of a predator (p) and its prey (q). (a)
Figure 18 shows a parametric curve c(t) = (p(t), q(t)) that models the changing population sizes of a predator (p) and its prey (q).
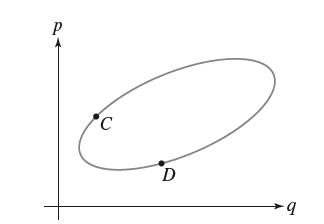
(a) Discuss how you expect the predator and prey populations to change as time increases at points C and D on the parametric curve.
(b) As functions of t, sketch graphs of p(t) and q(t) for three cycles around the parametric curve, beginning at point C.
(c) Both graphs in (b) should show oscillations between minimum and maximum values. Indicate which (predator or prey) has its peaks shortly after the other has its peaks, and explain why that makes sense in terms of an interaction between a predator and its prey.
P C D -9
Step by Step Solution
3.41 Rating (164 Votes )
There are 3 Steps involved in it
a At point C the population of the prey is near its minimum so we expect t... View full answer

Get step-by-step solutions from verified subject matter experts