

Figure 6 shows the migration rate M(t) of Ireland in the period 19881998. This is the rate
Question:
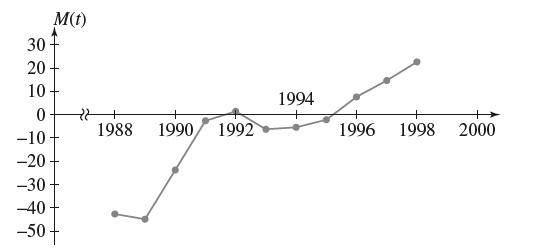
Figure 6 shows the migration rate M(t) of Ireland in the period 1988–1998. This is the rate at which people (in thousands per year) moved into or out of the country.
(a) Is the following integral positive or negative? What does this quantity represent?
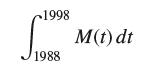
(b) Did migration in the period 1988–1998 result in a net influx of people into Ireland or a net outflow of people from Ireland?
(c) During which 2 years could the Irish prime minister announce, “We’ve hit an inflection point. We are still losing population, but the trend is now improving.”
Fantastic news! We've Found the answer you've been seeking!
Step by Step Answer:
a Because there appears to be more area below the taxis than above in Figure 6 is negative This quan...View the full answer

Answered By
Nazrin Ziad
I am a post graduate in Zoology with specialization in Entomology.I also have a Bachelor degree in Education.I posess more than 10 years of teaching as well as tutoring experience.I have done a project on histopathological analysis on alcohol treated liver of Albino Mice.
I can deal with every field under Biology from basic to advanced level.I can also guide you for your project works related to biological subjects other than tutoring.You can also seek my help for cracking competitive exams with biology as one of the subjects.
2+ Reviews
10+ Question Solved
Related Book For 

Question Posted:
