

Figure 7 shows the rate R(t) of natural gas consumption (billions of cubic feet per day) in
Question:
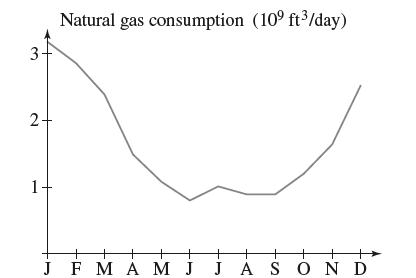
Figure 7 shows the rate R(t) of natural gas consumption (billions of cubic feet per day) in the mid-Atlantic states (New York, New Jersey, Pennsylvania). Express the total quantity of natural gas consumed in 2009 as an integral (with respect to time t in days). Then estimate this quantity, given the following monthly values of R(t):
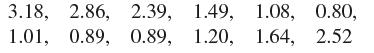
Keep in mind that the number of days in a month varies with the month.
Fantastic news! We've Found the answer you've been seeking!
Step by Step Answer:
The total quantity ...View the full answer

Answered By
GERALD KAMAU
non-plagiarism work, timely work and A++ work
6+ Reviews
11+ Question Solved
Related Book For 

Question Posted:
