

Question: Let be the function shown in Figure 28. Sketch the graphs of y = (x) and y = (x). 3 2 1 0 y
Let ƒ be the function shown in Figure 28.
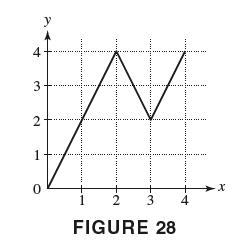
Sketch the graphs of y = ƒ(−x) and y = −ƒ(−x).
3 2 1 0 y 1 2 3 FIGURE 28 4 -X
Step by Step Solution
★★★★★
3.39 Rating (155 Votes )
There are 3 Steps involved in it
1 Expert Approved Answer
Step: 1 Unlock

The graph of ... View full answer
Question Has Been Solved by an Expert!
Get step-by-step solutions from verified subject matter experts
Step: 2 Unlock
Step: 3 Unlock