

Question: Let (x) be the function shown in Figure 1. Continue the graph of to the interval [4, 4] as an odd function. 3
Let ƒ (x) be the function shown in Figure 1.
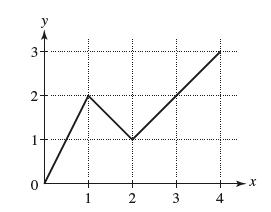
Continue the graph of ƒ to the interval [−4, 4] as an odd function.
3 2 1 0 y 1 2 3 4 X
Step by Step Solution
★★★★★
3.45 Rating (155 Votes )
There are 3 Steps involved in it
1 Expert Approved Answer
Step: 1 Unlock

To continue the graph of ... View full answer
Question Has Been Solved by an Expert!
Get step-by-step solutions from verified subject matter experts
Step: 2 Unlock
Step: 3 Unlock