

Question: Referring to the contour map in Figure 2: (a) Estimate the average rate of change of elevation from A to B and from A to
Referring to the contour map in Figure 2:
(a) Estimate the average rate of change of elevation from A to B and from A to D.
(b) Estimate the directional derivative at A in the direction of v.
(c) What are the signs of ƒx and ƒy at D?
(d) At which of the labeled points are both fx and fy negative?
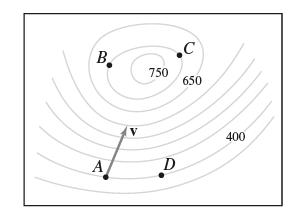
B A V 750 .C D 650 400
Step by Step Solution
★★★★★
3.53 Rating (153 Votes )
There are 3 Steps involved in it
1 Expert Approved Answer
Step: 1 Unlock

a From A to B The segment AB spans 6 level curves and the contour interval is m 50 m so the change o... View full answer
Question Has Been Solved by an Expert!
Get step-by-step solutions from verified subject matter experts
Step: 2 Unlock
Step: 3 Unlock