

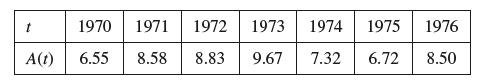
Use the following table of values for the number A(t) of automobiles (in millions) manufactured in the
Question:
Use the following table of values for the number A(t) of automobiles (in millions) manufactured in the United States in year t.
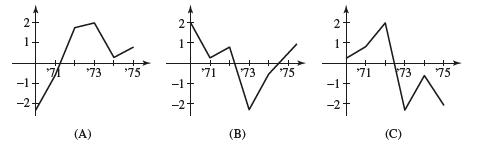
Given the data, which of (A)–(C) in Figure 6 could be the graph of the derivative A'? Explain.
Fantastic news! We've Found the answer you've been seeking!
Step by Step Answer:
The values of At increase then d...View the full answer

Answered By
Elias Gichuru
am devoted to my work and dedicated in helping my clients accomplish their goals and objectives,providing the best for all tasks assigned to me as a freelancer,providing high quality work that yields high scores.promise to serve them earnestly and help them achieve their goals.i have the needed expertise,knowledge and experience to handle their tasks.
325+ Reviews
859+ Question Solved
Related Book For 

Question Posted:
